Creating a Chart with OPCEx
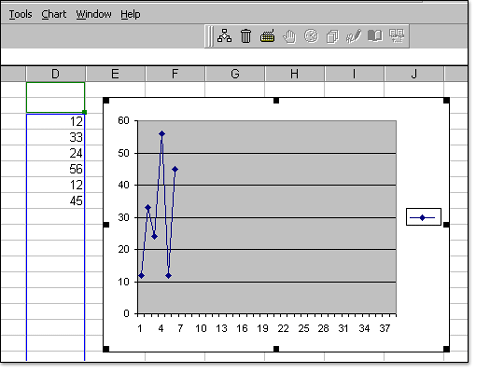
You can display OPC data graphically in a chart. Charts are linked to the
worksheet data they are created from and are updated when the OPCX updates the
worksheet data.
1. Click the cell to which you want to add the OPC data item.
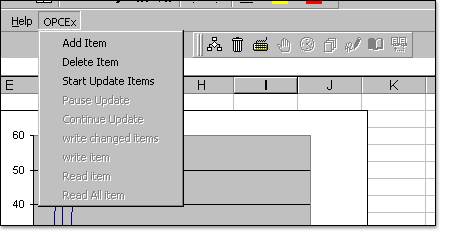
2. On the OPCEx menu, click Add Item. or On the OPCEx toolbar, click AddItem
3.In the Add Item dialog box, select or type the Node (if you are accessing the
local machine leave it blank) and server name you want to access, Changing the
server field will update the OPCbrowse tree.
4. Select the data item ID either typing then valid OPC data item id or double
clicking the leaves on the OPC browse tree.
5. If you like to update the next cell as shown in the figure select the update
next cell option. This will make it easy to create chart with the OPC server
data.
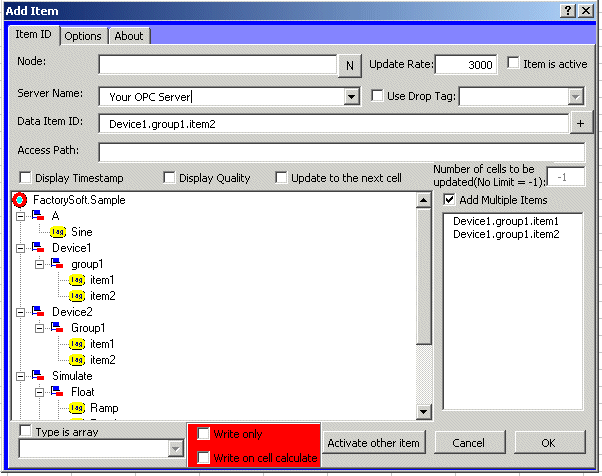
6. To update the item periodically check active state checkbox (if you don't
check this field the cell will not be updated until you click on the read
button.)
7. Click OK
8. Select the cells that contain the OPC data that you want to appear in the
chart.
9. Click Chart Wizard .
10. Select the Chart type
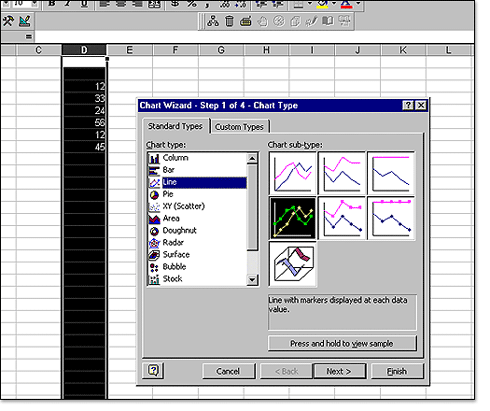
11. Follow the instructions in the Chart Wizard and click on Finish
button.
12. Click on on start update button. This will cause OPCEx to start updating
the worksheet data. and the chart.
|