Creating a Chart with OPC Web Studio 
											
											
											You can display OPC data graphically in a chart. Charts are linked to the OPC data they are created from and are updated when the OPC server updates the OPC items.
											 1. Click the design view. 
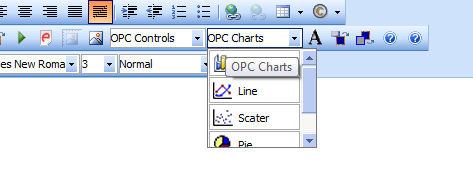
												2. On the OPC Web studio toolbar, click chart type 
											  
												3.In the chart property dialog box, select or type the server name you want to access, Changing the 
												server field will update the OPCbrowse tree. 
												4. Select the data item ID either typing then valid OPC data item id or double 
												clicking the leaves on the OPC browse tree. 
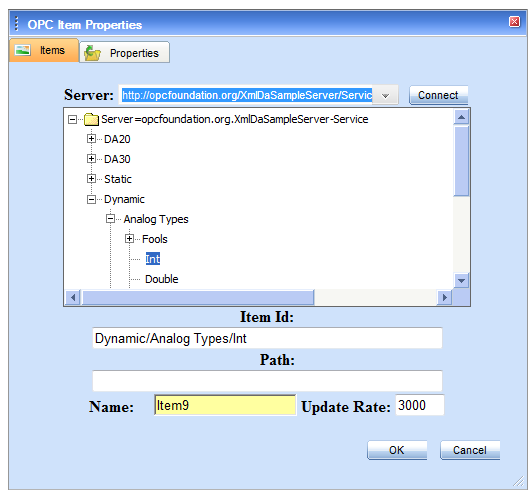
											  
												 
												6. Click OK 
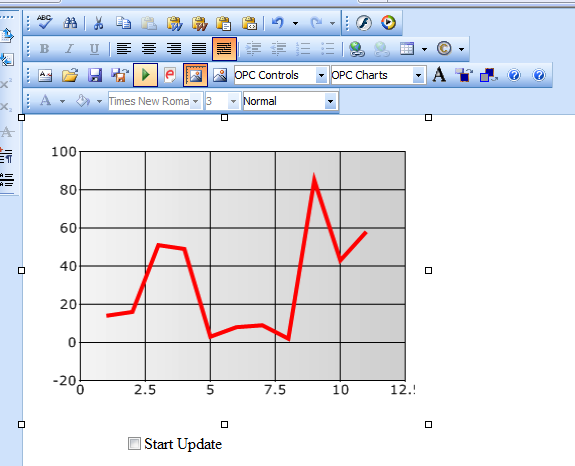
                                                7.Point to any edge of the chart.
 
                                                    8 Drag to resize the chart. 
                                                
                                                    9.Click Run 


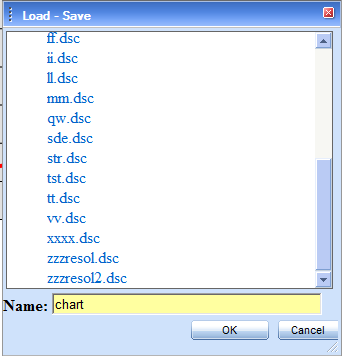
                                                    10- Type the name of the page on the save dialog  


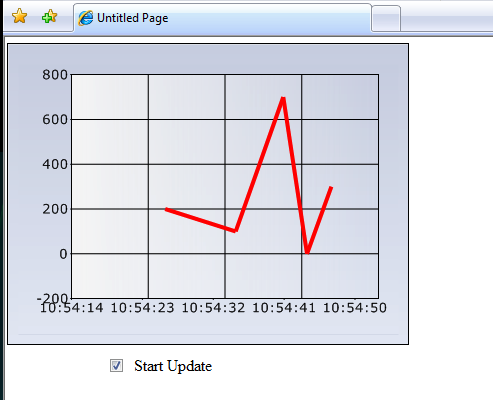
												12. Click on on start update checkbox. This will cause OPC web studio to start updating 
												the chart.
   
                                                 
										 |